Special Topic: Hadron Colliders> Time Series Graphs
Published November 2010

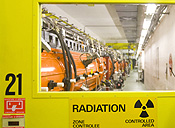
The Linac 2 is pictured at the
CERN in Meyrin near Geneva.
REUTERS/Denis Balibouse.
On the one-year time series graph, there is a bump in papers in 2002, perhaps reflecting the first papers coming out of the PHENIX collaboration. Another increase in paper volume is seen starting in 2005, and holding steady through 2007. These peaks might be accounted for by the work coming out of the STAR collaboration. A rather large spike shows in papers in 2008, which is likely due to the buzz surrounding the LHC. Citations also peak in years corresponding to the PHENIX and STAR collaborations. Citations per paper decline in a linear manner, as is generally expected.
The five-year time series graph of papers also shows the upswing of papers in the windows encompassing the years relevant to the launch of the large collaborative efforts at RHIC and LHC. Cites and cites per paper also show peaks during these periods, indicating that the research done during this time has been garnering considerable citation attention.
Hadron Colliders
- Top 20: Authors | Institutions | Journals | Nations
- Papers: 10-Year | 2-Year
- Research Front Map
- Time Series Graphs
- Field Distribution
- Interviews
Special Topics
- Complete Interview & Topic Menu; a list of all Special Topics with corresponding interviews, essays, or profiles.
- All Topics; listed by date and alphabetically.
- Special Topics Home