Special Topic: Planetary Exploration> Time Series Graphs
Published May 2011

On the one-year time series graph the number of papers climbs steadily to peak in 2008, and then shows a small decline. The growth rate was driven by papers from Cassini-Huygens and the Mars rovers. The prominent spike in 2005 is caused by papers from the Huygens mission to Titan. The rate of announcements from these long-running missions has declined, and no large planetary exploration missions were launched in the middle of the decade, leading to the recent decline in citations. The citations graphs show the expected decline due to the fact that more recent papers have had less time to accumulate citations.
In the five-year plots the steady upward trends suggest that planetary exploration has grown in a sustainable manner, rather than experiencing a big-bang expansion with each new mission.
General & Additional Information
Currently, we provide graphical representation by papers, cites, and cites/paper in both one- and five-year intervals. The graphs instantly show anomalies and trends: did one year have a higher or lower output than average?
What are Special Topics?
Special Topics, from ScienceWatch.com, is designed to complement Essential Science IndicatorsSM from Clarivate in providing citation analyses and commentary for selected scientific research areas that have experienced notable recent advances or are of special current interest.
Read about the overall methodology for Special Topics in the "What are Special Topics?" page.
Planetary Exploration
- Top 20: Authors | Institutions | Journals | Nations
- Papers: 10-Year | 2-Year
- Time Series Graphs
- Field Distribution
- Interviews
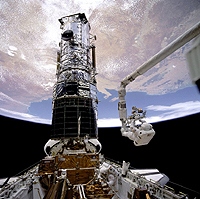
Featured Image
The Hubble Space Telescope stands tall in the cargo bay of the space shuttle Atlantis following its capture on Wednesday, May 13, 2009. Photo from NASA, and HUBBLESITE.
SPECIAL TOPICS